

Cough Data Captured During Sleep Could Flag Flu and COVID-19 Surges a Week Early
Key Takeaways:
- The UK Health Security Agency (UKHSA) and AI sleep technology company Sleep Cycle have published research showing that cough data collected passively by a smartphone sleep app closely reflects levels of respiratory illness reported through NHS 111 in England.
- Rises in night-time coughing were often observed around a week before increases in influenza and COVID-19 activity, offering an early signal that is not shaped by healthcare-seeking behaviour, laboratory turnaround times or reporting delays.
- The cough signal was found to be robust and regionally consistent, supporting a role for privacy-preserved consumer digital health data alongside, rather than instead of, established public health surveillance systems.
A new kind of respiratory signal
A study published by the UK Health Security Agency (UKHSA) and the AI sleep technology company Sleep Cycle has evaluated whether cough data gathered by a sleep app can give early indications of rising respiratory illness in England. The full results are available on medRxiv.
The researchers concluded that passively collected data of this kind can provide a robust and regionally consistent indicator of community respiratory illness, while also providing early signals for influenza and COVID-19 activity. Taken together, the authors argue, the findings support a wider role for digital health data in public health surveillance.
Crucially, the cough data was not gathered by asking anyone to report symptoms. It was generated automatically overnight, from the sound analysis that the app already performs as part of its everyday function.
Why existing surveillance has blind spots
Current respiratory surveillance in England depends heavily on people seeking care through the NHS. That dependence introduces a series of variables that have nothing to do with how much illness is actually circulating in a community.
Levels of public awareness can change how quickly people make contact with a service. The availability of that service matters too, as do demographic and socioeconomic differences between the populations being observed. Two areas with similar levels of illness may therefore generate very different surveillance figures.
Timing is a further constraint. Established systems are also affected by reporting and laboratory processing times, which means the picture available to public health teams is always, to some degree, a picture of the recent past rather than the present moment.
How the sleep app signal is generated
Sleep Cycle is a smartphone app designed to help people understand and improve their sleep through AI-powered sound analysis. The app listens during the night and interprets the sounds it detects, including coughing.
Unlike traditional surveillance, Sleep Cycle’s cough signal is generated automatically during normal sleep using privacy-preserved, passively collected data, and it is updated daily. That combination produces a near real-time view of respiratory illness activity, refreshed without anyone needing to complete a form, book an appointment or wait for a test result.
Because the data is produced as a by-product of ordinary app use, it sidesteps several of the behavioural and administrative filters that sit between illness in a community and the figures that reach public health teams.
A week’s head start on flu and COVID-19
The researchers found that cough data collected through the app closely reflected levels of respiratory illness reported through NHS 111. The two measures moved together, which is the first thing any candidate surveillance signal has to demonstrate.
More significantly, the two measures did not move together at the same moment. Increases in coughing were often observed around one week before increases in influenza and COVID-19 activity. The authors highlight this as evidence that passive digital health data can provide earlier situational awareness alongside established surveillance systems.
A week is a meaningful interval in respiratory season planning. It is time that can be used to prepare staffing, communicate with the public, and anticipate pressure on services rather than respond to it.
The findings suggest that, used alongside established surveillance systems, passive sleep monitoring could provide a fuller picture of respiratory surveillance data, helping public health experts better understand seasonal trends sooner.
What the researchers said
Professor Steven Riley, Chief Data Officer at UKHSA, said:
“These findings suggest that combining established surveillance approaches with novel digital health signals could contribute to an earlier, richer and more resilient understanding of population respiratory health.
No single surveillance system provides a complete picture of respiratory disease activity, but this shows that passive nocturnal cough monitoring can complement other surveillance systems to provide a timely population-level signal of upcoming disease trends, without being affected by healthcare-seeking behaviour, laboratory turnaround times, backfilling and reporting delays.”
Dr Emil Carlsson, Research Scientist and Co-lead Author, said:
“This study demonstrates that passively collected nightly cough data captures meaningful changes in community respiratory illness.
Equally important, it shows that consumer-generated health data can be transformed into epidemiologically meaningful surveillance signals using rigorous scientific methods while maintaining strong privacy protections.”
Dr Mikael Kågebäck, Chief Technology Officer and Acting Chief Executive Officer at Sleep Cycle, said:
“This study validates a completely new category of health data.
For the first time, we’ve demonstrated that passively generated smartphone data can produce robust population-level health intelligence at national scale, while also providing earlier signals for influenza and COVID-19 activity.
That creates opportunities to strengthen public health surveillance and enable researchers, healthcare organisations and industry partners to build new services for situational awareness and operational decision support.”
Complement, not replacement
Both organisations frame the work in the same way. The cough signal is not presented as a substitute for laboratory confirmation, clinical reporting or NHS 111 data. It is presented as an additional layer that behaves differently from the others, and whose value lies precisely in that difference.
As Professor Riley notes above, no single surveillance system provides a complete picture. A signal that is unaffected by whether people choose to seek care, and unaffected by how long a laboratory takes to process a sample, fails in different ways from the systems already in place. Combining sources with different weaknesses is a well-established way of building a more resilient overall view.
What it means for clinicians and health organisations
For practitioners, the study is a practical illustration of a broader shift. Data generated by consumer devices is increasingly being assessed against the standards applied to conventional health data, and in this case it held up well enough to warrant serious attention from a national public health body.
That shift raises questions clinicians and managers are likely to encounter more often: how such signals are validated, what privacy protections are in place, how to judge the reliability of a consumer-generated dataset, and where these tools genuinely add value to decision-making. Professionals looking to build confidence in this area may find structured CPD useful, and The College of Contemporary Health’s short course AI Essentials for Primary Care is designed to help healthcare professionals understand how AI-driven tools are being applied in practice and how to appraise them critically.
A note on the status of this research
This was reported in medRxiv, The Preprint Server for Health Sciences. The following caution applies, as it does to all preprints:
Preprints are preliminary reports of work that have not been certified by peer review. They should not be relied on to guide clinical practice or health-related behavior and should not be reported in news media as established information.
The findings described here should therefore be read as promising and carefully conducted early-stage research rather than as settled evidence. Peer review may yet refine the conclusions, the size of the reported lead time, or the conditions under which the signal performs best.
CCH insight
Digital health signals are moving quickly from novelty to everyday practice, and healthcare professionals are increasingly expected to interpret them with the same rigour they apply to any other source of clinical or population data.
AI Essentials for Primary Care is a CPD short course from The College of Contemporary Health, developed for healthcare professionals who want a clear, practical grounding in how artificial intelligence is being used across healthcare settings and how to evaluate it responsibly.
Explore AI Essentials for Primary Care →
Source: GOV.UK
Read More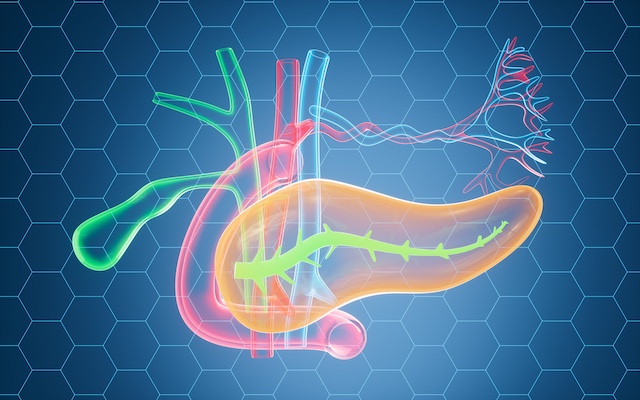
AI Model Detects Diabetes and Sorts Records Into Four Diagnostic Categories
Key Takeaways:
- Researchers have built a machine learning framework that first detects diabetes and then assigns positive records to one of four categories: prediabetes, type 1 diabetes, type 2 diabetes, or diabetes arising from pancreatic disease.
- XGBoost was the authors’ preferred classifier, though the paper reports inconsistent performance rankings across its own tables, with random forest outperforming it in one comparison.
- The framework is a proof-of-concept only. It has not been externally validated, its two stages were trained on separate datasets, and it is not ready for clinical use.
Why diabetes subtyping is a difficult problem
Diabetes is among the most common metabolic conditions worldwide, and its prevalence continues to rise. People living with diabetes typically experience raised blood glucose levels caused by insufficient insulin secretion, insulin resistance, or a combination of the two. Where hyperglycaemia persists, it can lead to serious complications affecting the eyes, heart, kidneys and nerves.
That burden has prompted interest in new strategies for detecting and classifying diabetes using clinical data that is already routinely available. If such tools were externally validated, they could in principle help clinicians identify individuals who warrant further diagnostic assessment, and support decisions about dietary, lifestyle or pharmacological management.
A study accepted for publication in Scientific Reports sets out one such approach: a machine learning (ML) model built on common clinical variables and a derived pancreatic-health index, designed both to detect diabetes and to classify it. The authors are explicit that clinical utility, patient outcomes and quality of life were not assessed.
About the study
The researchers presented an integrated, ML-based approach with two stages. Binary classification was used to determine diabetes status, and multiclass classification was then used to assign records to one of four dataset classes: prediabetes (PD), type 1 diabetes (T1D), type 2 diabetes (T2D), and diabetes from pancreatic disease, also known as pancreatogenic or type 3c diabetes (T3cD).
Two publicly available datasets were used. For the binary task, the team drew on the Pima Indians Diabetes Database, maintained by the National Institute of Diabetes and Digestive and Kidney Diseases (NIDDK), to separate records into diabetic and non-diabetic. For the multiclass task, they used a dataset from the Kaggle repository. The curated multiclass dataset comprised 21,539 samples, split 60% for training and 40% for testing.
How the models were built and tested
Inputs to the multiclass model included age, body mass index (BMI), waist circumference, cholesterol levels, blood glucose levels, insulin levels, and a derived pancreatic-health index.
Several ML algorithms were compared to identify the most effective approach for each classification task: logistic regression, decision trees, random forests, K-nearest neighbours (KNN), naive Bayes, and XGBoost.
To correct class imbalances, the team applied the Synthetic Minority Oversampling Technique (SMOTE) to the training data only. Hyperparameter tuning was then carried out to identify the best-performing parameter combinations, and the models were retrained using those selected parameters. Finally, the researchers ran a Local Interpretable Model-agnostic Explanations (LIME) analysis on their preferred classifier to examine how individual features contributed to model predictions.
What the models achieved
The authors selected XGBoost as their preferred classifier, although the paper’s reported performance rankings are not consistent across tables. Table 2 gives a value of 0.97 for every evaluation parameter, covering accuracy, precision, recall and F1 score. Table 7, however, reports an accuracy of 95.67% for XGBoost against 96.67% for random forest, with random forest also achieving a marginally higher macro-average ROC-AUC, a measure of how well a model discriminates across the four classes.
The researchers attributed XGBoost’s performance to its capacity to capture complex, non-linear associations between features. In the reported test results, XGBoost correctly classified all prediabetes and T1D records, though some confusion persisted between the T2D and T3cD groups. KNN was the least accurate of the algorithms tested.
This kind of discrepancy between a paper’s headline claim and its own supporting tables is exactly the sort of detail clinicians are increasingly expected to spot for themselves. CCH’s CPD-accredited short course AI Essentials for Primary Care covers structured appraisal of AI tools, including the SAFER Evaluation Framework and how to judge AI output against NHS standards.
Which features drove the predictions
General feature-importance analysis pointed to blood glucose levels, insulin and BMI as the most influential variables. The LIME analysis told a slightly different story, indicating that glucose dominated the model’s predictions, with age and cholesterol making secondary contributions in some classes. BMI, waist circumference, insulin and pancreatic health had comparatively lower influence in the LIME results.
Blood glucose levels showed the strongest reported correlation with the class label, at a Pearson’s correlation of 0.86, while insulin showed a correlation of 0.59. These correlations should be treated with caution, since numerical values were assigned to what are, in fact, nominal disease classes.
Age, BMI and waist circumference showed moderate to strong intercorrelations, ranging from 0.63 to 0.68. Their respective correlations with the target were 0.41, 0.46 and 0.56. Pancreatic health showed a negligible negative correlation of -0.06.
In practice, the model primarily learned blood glucose-based decision patterns, which are consistent with the clinical diagnosis of diabetes. The authors interpreted these patterns as broadly concordant with diabetes pathophysiology and existing clinical knowledge, though that interpretation was not independently validated in clinical practice. On the evidence presented, the model is not ready for clinical use and would require considerably more evaluation before it could support, rather than replace, clinical judgement.
Conclusions and future directions
The study demonstrates an ML framework capable of classifying diabetes status and assigning positive cases to four labels: prediabetes, T1D, T2D and T3cD. The authors suggest the framework could eventually assist with diabetes screening and help guide further diagnostic investigation. Crucially, the study did not establish whether using the model improves care, treatment outcomes, quality of life, or the wider global burden of diabetes.
The varying influence of lipid, pancreatic and body measurements may reflect genuine subtype-related biological differences. Equally, it may be an artefact of dataset construction, class coding, correlated predictors, or the absence of clinically verified biomarkers. The authors recommend that these patterns be investigated in clinically characterised datasets before any mechanistic conclusions are drawn.
The framework should currently be regarded as a modular proof-of-concept, because its binary and multiclass stages were trained on separate datasets that may differ in population, variables and collection methods.
Future work, the authors suggest, should use a single training dataset containing both diabetes status and clinically adjudicated subtype labels, including verified pancreatic and autoimmune markers rather than derived variables. External validation in larger and more diverse clinical cohorts would be needed to improve generalisability. Ethical and data privacy concerns would also need to be addressed before any AI-based model of this type could be translated into clinical screening or decision-support settings.
CCH insight
Studies like this one arrive faster than most clinicians can appraise them, and the gap between a promising accuracy figure and a tool that is safe to use in practice is wide. Knowing how to interrogate that gap is now a core professional skill.
AI Essentials for Primary Care is a 100% online, CPD-accredited short course providing 3.5 CPD hours and a Certificate of Completion. It equips the whole primary care team to evaluate AI tools against NHS standards, recognise when AI output should be questioned, and apply the SAFER Evaluation Framework in day-to-day practice. No technical background is required.
Explore AI Essentials for Primary Care →
Read More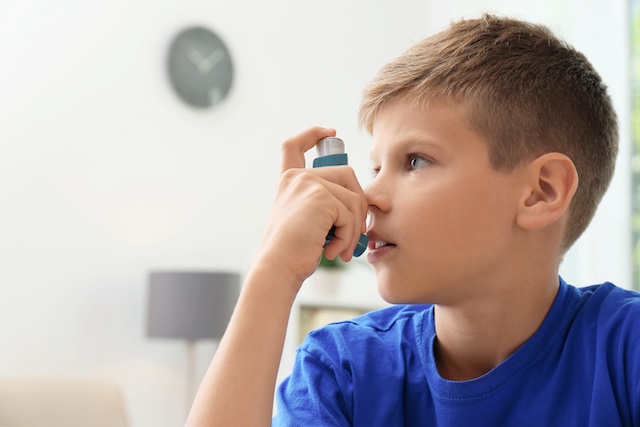
Machine Learning Tool Helps Paediatricians Identify Children at Risk of Persistent Asthma
Key Takeaways:
- A machine learning tool that reads data already held in a child’s electronic health record helped paediatricians more accurately judge which young children are at risk of persistent asthma.
- In a pilot randomised trial using standardised clinical cases, clinicians using the tool reached an average accuracy of 83%, compared with 61% for standard assessment alone.
- The tool is designed to support clinical judgement rather than replace it, and requires no additional tests or questionnaires.
Support for a difficult clinical judgement
A machine learning tool that analyses information already captured in a child’s electronic health record (EHR) has helped paediatricians assess asthma risk more accurately in standardised clinical case scenarios, according to a pilot randomised clinical trial led by a researcher at the Regenstrief Institute. The study was published in the journal Scientific Reports.
The trial evaluated a machine learning-enabled clinical decision support tool known as the Passive Digital Marker. The tool draws on routinely collected EHR data to classify young children as having either a high or a low risk of going on to develop persistent asthma.
Why early asthma risk is hard to predict
Asthma is one of the most common long-term conditions of childhood, yet predicting which young children who have wheezing or other respiratory symptoms will later develop persistent asthma remains difficult. Some children outgrow their early symptoms, while others need ongoing treatment. That uncertainty makes early risk assessment an important, but genuinely challenging, part of paediatric care.
“This tool doesn’t replace a pediatrician’s clinical judgment,” said Arthur H. Owora, PhD, Regenstrief Institute research scientist and lead author of the study. “It helps bring together years of clinical information that’s already in the electronic health record, giving clinicians another source of information when making decisions about a child’s asthma risk.”
How the Passive Digital Marker works
Unlike many prediction tools, the Passive Digital Marker requires no extra testing and asks families to complete no additional questionnaires. Instead, it analyses information that has already been documented in the child’s EHR, including respiratory symptoms, allergies, medication history, respiratory infections and family history. It then presents clinicians with a straightforward high-risk or low-risk assessment.
This approach is intended to save clinicians’ time and reduce the burden on families, since it relies on data that has been gathered over the course of a child’s routine care rather than requiring anything new at the point of decision.
What the trial found
Paediatricians using the tool correctly predicted future asthma more often than those relying on standard assessment alone, achieving an average accuracy of 83% compared with 61%. The improvement was largely driven by better identification of children who went on to develop persistent asthma – the group that is most important to recognise early and hardest to spot.
The researchers stress that the tool is meant to support clinical decision-making, not to supplant it. Its value lies in helping clinicians quickly synthesise years of patient information into a single, easy-to-interpret risk assessment that sits alongside their own expertise. That distinction – between having an AI tool to hand and knowing how to weigh what it tells you – is becoming central to how clinicians are expected to work with these systems.
Limitations and next steps
Because the study used standardised patient cases rather than real-world clinical encounters, further research is needed to establish whether the tool improves outcomes for children in everyday paediatric practice. The pilot demonstrates promise in a controlled setting, but real-world validation is the necessary next stage before wider adoption.
CCH insight
Tools like the Passive Digital Marker are only ever as good as a clinician’s ability to judge when to lean on them and when to look again. That skill – evaluating an AI tool, recognising where it can mislead, and putting sensible governance around its use – is exactly what our short course AI Essentials for GPs: Tools, Ethics and Everyday Applications is designed to build. It’s a 3.5-hour, fully online CPD course led by Prof. Mike Bewick and Dr Dipesh Naik. [Explore the course →]
Funding and authorship
The study was supported in part by the National Institutes of Health under grant K01HL166436. In addition to Owora, it was co-authored by Bowen Jiang, M.S., and Yash Shah, M.S., of the Division of Pediatric Pulmonology, Allergy/Immunology and Sleep Medicine, Department of Pediatrics, Riley Hospital for Children, Indiana University School of Medicine.
Source: Regenstrief Institute
Read More
AI Blood Test Could Detect Early Eye Nerve Damage in People with Type 2 Diabetes
Key Takeaways:
- An AI tool called Pro-DRN uses a blood sample to flag people with type 2 diabetes at high risk of diabetic retinal neurodegeneration (DRN), before any damage shows on the retina.
- It was trained on 1,218 participants and validated in 502 people from UK Biobank, identifying 71 proteins linked to DRN – with ACTA2, COL6A3 and HSPG2 the strongest predictors.
- As retinal nerves are among the first tissues affected by diabetes, the test could also hint at wider nerve damage and help target earlier monitoring and future treatments.
A simple blood test to catch nerve damage early
Scientists have developed an AI-assisted prediction tool that can identify people with type 2 diabetes who are at high risk of developing diabetic retinal neurodegeneration (DRN) before symptoms appear. The findings were published in the journal PLOS Medicine.
The work was led by Wei Wang, MD, PhD, associate professor at the Guangdong Provincial Clinical Research Center for Ocular Diseases. According to the authors, the damage that diabetes inflicts on the delicate nerves of the eye appears to leave a detectable molecular trail in the bloodstream long before it becomes visible in the eye itself.
“Our study suggests that early retinal nerve damage in diabetes leaves measurable signals in the blood,” write the authors. “These findings suggest that a simple blood test analyzed with artificial intelligence may help identify people with diabetes who are at highest risk of early retinal nerve damage, well before visible damage appears on the retina.”
Why the retinal nerves matter in diabetes
Type 2 diabetes affects more than half a billion people worldwide, and it carries an increased risk of long-term complications, including progressive neurodegeneration – the gradual deterioration of nerve tissue over time.
The nerves of the retina are among the earliest tissues to be affected. As this damage advances, it can eventually lead to severe visual impairment and the loss of sight. The difficulty for clinicians is one of timing: current diagnostic methods can only detect DRN once the retina has already sustained irreversible damage. By the time the problem is visible, the window for early, protective intervention has often closed.
How the Pro-DRN tool was built
To address this, Wang and colleagues developed a machine learning algorithm called Pro-DRN. They drew on data from 1,218 participants in the Guangzhou Diabetic Eye Study, all of whom had been diagnosed with type 2 diabetes but had not yet developed DRN at the point of enrolment.
The model combined two distinct streams of information. The first was proteomics data – a detailed read-out of the proteins circulating in participants’ blood samples. The second was a series of yearly retinal images, capturing the state of the eye over a six-year follow-up period. By matching the molecular signals in the blood against how each person’s retina changed year on year, the algorithm learned which blood-borne patterns preceded the onset of nerve damage.
The proteins behind the predictions
The analysis surfaced 71 proteins associated with the development of DRN. Of these, three stood out as the most consistent drivers of accurate prediction: ACTA2, COL6A3 and HSPG2. These are key structural components involved in maintaining the integrity of the nerve and muscle tissue in the eye, which helps explain why disturbances in their levels might signal nerve tissue under strain.
Crucially, the team did not rely on a single dataset. The results were validated in an independent cohort of 502 people from UK Biobank, where the core effects and protein signals were reproduced – an important check that the findings were not simply a quirk of the original group.
From research tool to clinical aid
Pro-DRN has been made available as an interactive, web-based risk assessment tool that clinicians can use to support early DRN screening and to monitor how a person’s risk evolves over time. People identified as being at high risk could then benefit from more frequent check-ups and from early interventions aimed at preventing or slowing progressive neurodegeneration, rather than waiting for damage to become apparent.
A window into the wider nervous system
The potential significance of the test reaches beyond the eye. Because DRN is one of the first signs of nerve degeneration brought on by diabetes, detecting it early could also signal the onset of nerve injury elsewhere in the body.
Such damage can contribute to cognitive impairment, dementia and peripheral neuropathy – the latter causing loss of sensation and motor control in the hands, feet and other extremities. Viewed this way, a single eye-focused test could offer valuable insight into the overall health of a person’s nervous system.
New possibilities for treatment and trials
The discoveries also open up two further avenues. The proteins identified as being involved in DRN progression could be investigated as potential targets for the development of new therapies. In addition, the AI-based tool could prove useful for selecting and stratifying participants in clinical trials that are evaluating neuroprotective strategies designed to prevent or delay nerve damage – helping ensure such studies enrol the people most likely to show a measurable benefit.
Looking ahead
For the researchers, the broader ambition is a shift in how diabetic eye care is approached – from reacting to damage that has already occurred towards anticipating who is most vulnerable.
“Pro-DRN may help move diabetic eye care from detecting established damage toward earlier, molecularly informed risk stratification, so that closer monitoring and future neuroprotective interventions can be directed to the people most likely to benefit,” Wang and colleagues write.
Read More